Rainmeter Alternatives for System Monitoring on Windows (2026)
Most people who search for a Rainmeter alternative are not looking for a wallpaper. They want four or five numbers on the desktop — how hard the CPU is working, what the GPU is doing, how much RAM is gone, whether the drive is thrashing, what the network is pulling — without opening Task Manager for the ninth time today.
That is a narrower problem than "desktop customization", and it has a wrinkle that catches people out: not all of those numbers cost the same to obtain. Some are handed to any application that asks. Others require a signed kernel driver, an elevation prompt, and — since 2025 — an argument with Microsoft Defender. Picking the right tool means knowing which side of that line the numbers you want fall on.
The line that splits every monitoring tool
Windows has no unified hardware sensor API. What it does have is a large set of performance counters, plus a graphics driver that reports its own state. Anything that lives in those two places is free to read. Anything that lives on the motherboard's low-level buses is not.
| Reading | Where it comes from | Kernel driver / elevation? |
|---|---|---|
| CPU utilization, total and per-core | Windows performance counters | No |
| CPU clock speed | Performance counters / OS power data | No |
| CPU package and per-core temperature | On-die sensors read over MSRs (Intel DTS, AMD Tctl/Tdie) | Yes |
| GPU utilization, VRAM in use, model name | WDDM counters and the graphics driver | No |
| GPU core and memory-junction temperature | Vendor user-mode libraries (NVML, ADL) | No, but vendor-specific |
| NVMe / SSD temperature, wear, SMART | NVMe log pages and SMART queries | Elevation, usually |
| Fan RPM, voltages, VRM currents | Motherboard super-I/O chip over ISA / SMBus | Yes |
| Disk read/write throughput, free space | Performance counters, filesystem | No |
| Network up/down throughput | Performance counters | No |
Read that table once and the whole product landscape makes sense. Everything in the "No" rows can be done by an ordinary desktop app. Everything in the "Yes" rows requires a program that loads a driver into the kernel — which is exactly the class of software Microsoft has spent the last two years tightening down on.
The sensor-access problem nobody warns you about
A lot of free monitoring tools do not write their own kernel driver. They embed a well-travelled one called WinRing0, which has been the de facto way to read model-specific registers and super-I/O chips on Windows for over a decade. The catch is CVE-2020-14979: WinRing0 can read and write arbitrary memory, which means any process that can talk to it inherits kernel-level power.
Microsoft Defender now flags it. Users started seeing HackTool:Win32/Winring0 and vulnerable-driver warnings on tools they had been running happily for years — LibreHardwareMonitor, FanControl, OpenRGB, and a pile of vendor utilities from motherboard and peripheral makers. It is not a false positive in the usual sense. The apps are not malicious; the driver they carry is genuinely exploitable, and Defender is playing it safe.
Practically, this means a temperature-and-fans monitoring setup in 2026 involves at least one of: an antivirus exclusion, a driver-blocklist exception, or turning off Memory Integrity. If that sounds like more than you signed up for, it is worth asking whether you actually need thermal data on the desktop at all, or whether utilization is what you were after the whole time.
The four realistic options, compared
| Stack | Reads | Driver / admin | Where it appears | Setup | Price |
|---|---|---|---|---|---|
| Rainmeter + HWiNFO | Everything: per-core load and temps, GPU core and hotspot, VRAM, NVMe temps, fans, VRM, throughput | HWiNFO needs elevation; Rainmeter does not | Anywhere on the desktop, any layout | Hours, in INI files | Both free; HWiNFO Pro from $29/yr |
| Themia | CPU load and clock, GPU load and VRAM, RAM in GB, disk read/write and free space, network up/down | None of these readings need the low-level path | Widgets on the desktop, per-screen layouts | Minutes, from a menu | Free tier · $19 one-time Pro |
| Wallpaper Engine | Nothing natively — needs a companion app to feed it | Depends on the companion | Inside the wallpaper itself | Varies wildly by wallpaper | One-time on Steam |
| Windows 11 built-ins | CPU, GPU, RAM, disk, network utilization; GPU temp when the driver reports it | None | Task Manager window, Game Bar overlay | Already installed | Free |
| MSI Afterburner + RTSS | GPU and CPU sensors including temps, framerate, frametime | Yes, for the sensor side | On-screen overlay, always on top | Twenty minutes of ticking boxes | Free |
| LibreHardwareMonitor | Same sensor breadth as HWiNFO, slightly shallower on exotic boards | Yes — this is the WinRing0 one | Its own window, or as a data source | Download and run | Free, open source |
Rainmeter + HWiNFO — the complete answer, if you have the evening
Rainmeter is still the ceiling. Version 4.5.26 shipped in May 2026, it is free and open source, and paired with a sensor tool it will put any number your motherboard produces anywhere you want it, styled however you want. This is the setup people picture when they picture a monitoring desktop.
Two things to know before you start. First, the community HWiNFO plugin for Rainmeter is no longer actively developed; the route Rainmeter's own documentation points at is HWiNFO's registry output — a feature originally built for Windows Sidebar gadgets — read back with a Registry measure. It is a little fiddly to wire up, but it works on the free HWiNFO build and it means Rainmeter itself never needs elevation. HWiNFO does, as anything touching hardware does.
Second, HWiNFO's Shared Memory interface — the cleaner path that other apps subscribe to — is time-limited to twelve hours per session on the free build. For a machine you leave on, that is a daily nudge toward a Pro licence, which runs $29 a year for personal use or from $129 for a lifetime key. HWiNFO 8.50 is the current stable release as of July 2026 and its sensor coverage is genuinely unmatched, so it may well be worth it. Just know the free-forever version of this stack has a caveat.
The real cost of Rainmeter is time, not money. Every element is positioned by hand in an INI file, DPI scaling needs tuning per machine, and skins from 2019 break on hardware from 2026. If you enjoy that, the payoff is real. If you were hoping to be done in ten minutes, keep reading.
Themia — the display surface, without shipping its own driver
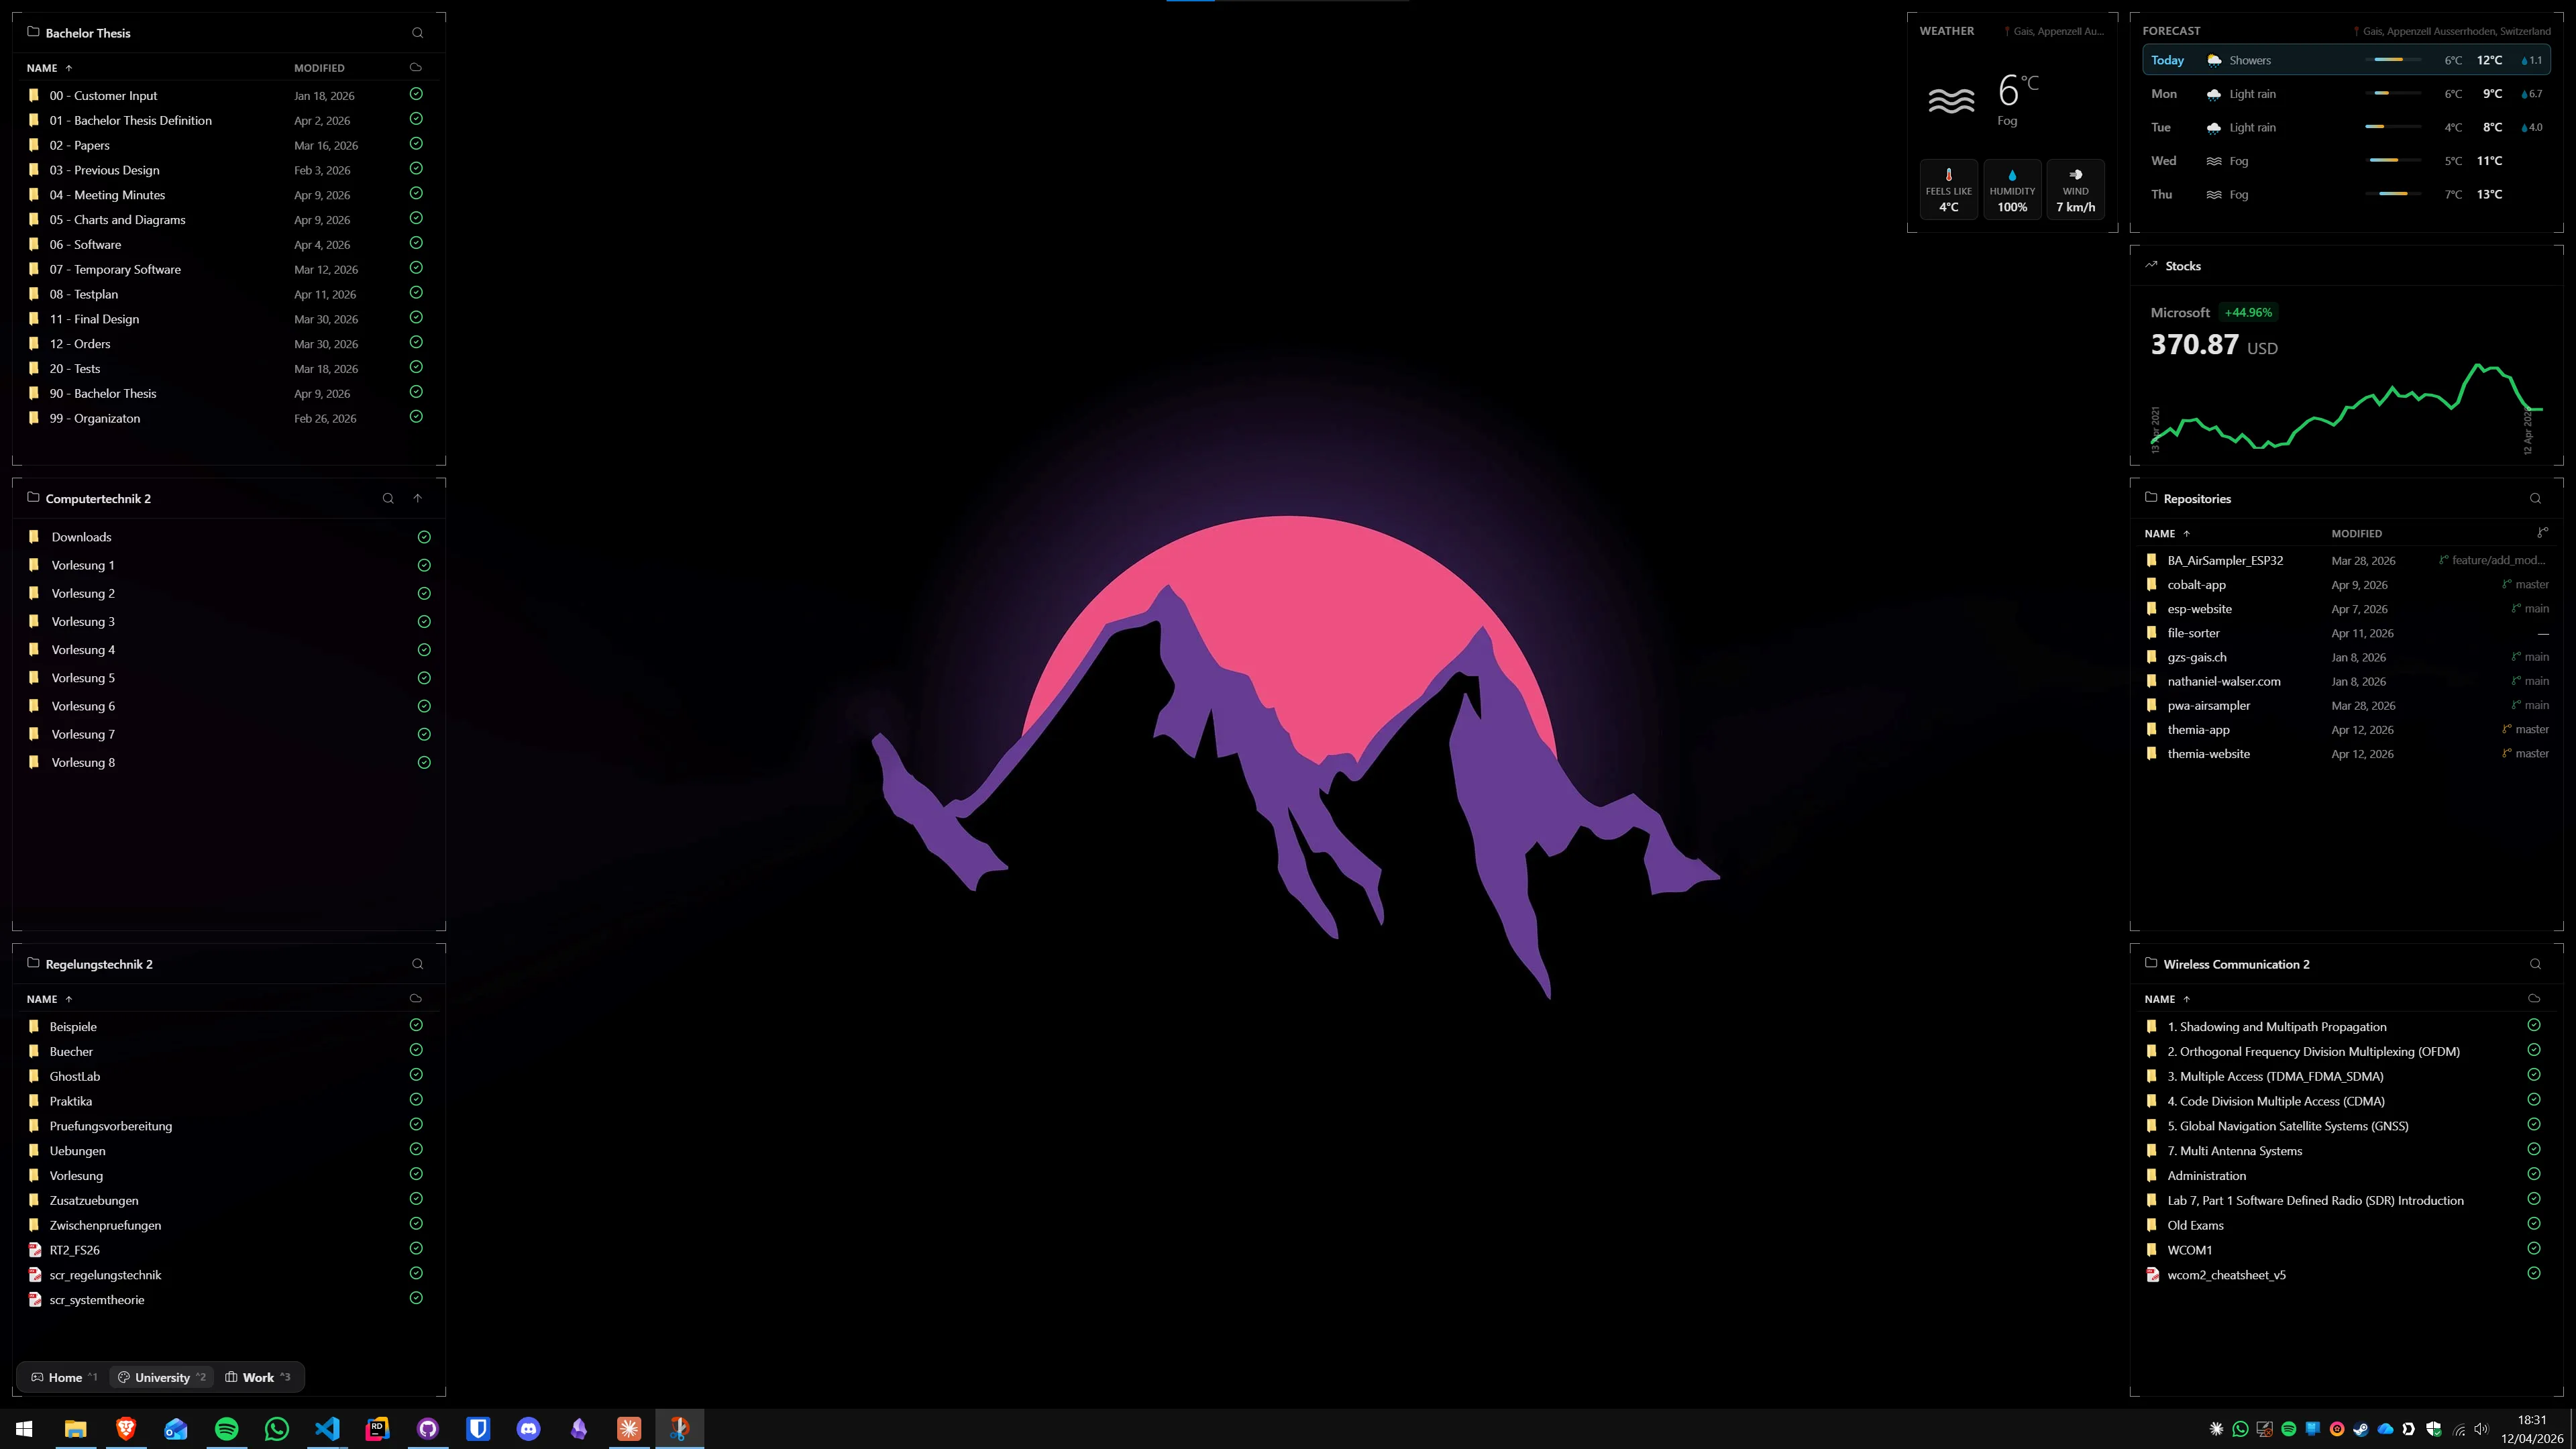
Themia is a native Windows app that puts widgets directly on the wallpaper, added from a menu rather than a config file. On the monitoring side it ships five relevant widgets: CPU, GPU (utilization and video memory, one panel per card if you have several), RAM (in use against total, with a rolling graph), Disk (free space plus read/write throughput, measured per drive rather than system-wide) and Network (up and down on one shared vertical scale, so you can see which direction is actually carrying traffic). There is a Battery widget, and a Ping widget for latency, jitter and packet loss against a host you choose.
The CPU widget is the one worth describing properly, because it is a pick-your-rows affair rather than a fixed panel. Available metrics are usage, frequency, the aggregate graph, per-core graphs, temperature, fan speed, top processes, process and thread counts, and uptime. Switch on per-core and the single sparkline becomes a grid of small ones. Usage changes colour as it climbs — accent below 70%, amber to 89, red at 90 — across the number, the graph and the bar together, which is what makes a loaded machine readable from across the room.
Now the part that matters for this comparison. Themia does not bundle a kernel driver, which means it does not carry the WinRing0 problem described above — but it also means it has no driver-free way to reach on-die sensors. Temperature and fan speed are read from LibreHardwareMonitor or OpenHardwareMonitor if one is already running, falling back to the ACPI thermal zone otherwise. On many consumer AMD boards that ACPI zone reports nothing, so a real on-die reading needs LibreHardwareMonitor present. Fan speed has no driver-free source at all — without LHM or OHM it is simply unavailable. When a source is missing the row shows Temp N/A rather than disappearing, which is the right call: a metric you switched on vanishing reads as a bug.
So the honest shape of this option is display surface, not sensor stack. Utilization, clocks, throughput and free space work on their own out of the box. Temperatures and fans work if you already run a sensor tool — and if you do, you get them on the wallpaper without also running that tool's own UI. What Themia will not do is tell you your NVMe drive is at 68 °C, or report voltages and VRM currents.
Setup is a few minutes: install, add widgets, drag them where you want them. Per-screen switchable layouts let you keep a dense stats cluster on a second monitor and a clean primary desktop. Free tier, $19 one-time for Pro, under 10 MB installed. Several system widgets share one cached sample, so adding more of them does not multiply the sampling cost. For the full temperature picture, the approach in how to show CPU and GPU temperature on Windows still applies.
Wallpaper Engine — beautiful, and not a monitor
This one comes up constantly and deserves a straight answer: Wallpaper Engine does not read hardware sensors. It is an animated wallpaper engine, and a superb one. The monitoring wallpapers you see in the Workshop work by pairing with a separate companion app that reads the metrics and feeds them into the wallpaper — community projects exist for exactly this, and some of them can pull richer data from HWiNFO if you have it running.
That setup can look spectacular. It is also three moving parts, each maintained by a different person, any of which can break on a Windows update. Treat Wallpaper Engine as the background layer and put your numbers somewhere more stable on top of it.
Windows 11 built-ins — better than they used to be, worse than they were
Task Manager's Performance tab is genuinely good now: live graphs for CPU, memory, disk, network and GPU, with GPU temperature shown when the graphics driver reports it. There is still no CPU temperature anywhere in Windows, and there probably never will be. The Xbox Game Bar performance widget covers the same ground as a floating overlay, which suits gaming.
The part that got worse: the CPU, GPU, RAM and network widgets you could once pin to the Windows 11 Widgets Board came from Dev Home. Microsoft announced Dev Home's deprecation in January 2025 and stopped supporting it in May 2025 — the old install link now redirects to the Windows Advanced Settings app. So the one first-party route to a pinnable system-monitor widget is gone, and Windows 11 Widgets went unmentioned at Build 2026. If you were waiting for Microsoft to solve this, stop waiting.
Two worth knowing about
MSI Afterburner with RivaTuner Statistics Server renders sensors as an overlay that follows you into full-screen applications — right for benchmarking, wrong for a calm desktop. LibreHardwareMonitor — v0.9.6, released February 2026 and now built on .NET 10 — is the open-source sensor tool of choice and a common data source for third-party dashboards. It is also the most prominent tool caught by the WinRing0 flagging, so expect to make a Defender exception.
How to choose in thirty seconds
- You want voltages, VRM currents and NVMe temps on the wallpaper, and you enjoy configuring things → Rainmeter plus HWiNFO. Budget an evening.
- You want CPU, GPU, RAM, disk and network at a glance and want to be finished today → a native widget app like Themia. Add LibreHardwareMonitor if you also want the temperature and fan rows.
- You are benchmarking or overclocking → Afterburner and RTSS, with HWiNFO logging in the background.
- You only check occasionally → Task Manager is already installed and is better than you remember.
- You want the desktop to look incredible → Wallpaper Engine underneath, real widgets on top.
One last thing about stacking tools
Do not run three sensor readers at once. HWiNFO, LibreHardwareMonitor, HWMonitor and vendor utilities all poll the same physical hardware, and some of those reads — SMART queries and VRM polling especially — briefly take exclusive access. Two is usually fine. Four produces intermittent blank readings that look like a hardware fault and are not. Pick one as the source of truth.
Beyond that, the choice is simply which half of the first table you need. If it is the free half, a modern widget app will get you there in minutes. If it is the privileged half, Rainmeter and HWiNFO have been the answer for fifteen years and still are. For the wider view of what else replaces Rainmeter, see the best Rainmeter alternatives for Windows, the head-to-head in Themia vs Rainmeter, or the narrower walkthrough on showing network speed on the Windows desktop.
FAQ
What is the best Rainmeter alternative for system monitoring?
It depends which numbers you need. For utilization — CPU load and clock, per-core graphs, GPU load and VRAM, RAM, disk read/write, network up/down — a native widget app like Themia puts all of it on the desktop with no config files and no kernel driver. Temperatures and fan speed need a sensor source: LibreHardwareMonitor or OpenHardwareMonitor running in the background, which Themia and Rainmeter can both read from. Voltages and VRM currents are sensor-tool territory only.
Can I monitor CPU and GPU without installing a driver?
Partly. CPU and GPU utilization, clock speed, VRAM, memory in use, disk throughput and network throughput all come from Windows performance counters and the graphics driver, so no extra kernel driver is involved. CPU die temperature, fan RPM and voltages are read over low-level buses Windows does not expose, which is why every tool reporting them ships a kernel driver and asks for elevation.
Why does Windows Defender flag my hardware monitor as a HackTool?
Because of WinRing0. Many open-source monitoring and fan-control tools embed WinRing0x64.sys, a kernel driver that can read and write arbitrary memory — tracked as CVE-2020-14979. Microsoft Defender now flags it as HackTool:Win32/Winring0. The apps are not malicious, but the driver genuinely is exploitable. LibreHardwareMonitor, FanControl and OpenRGB were all caught by this.
Does the Rainmeter HWiNFO plugin still work in 2026?
The community-written Rainmeter plugin is no longer actively developed. The route Rainmeter documents instead is HWiNFO's registry output — a mode originally built for Windows Sidebar gadgets — which you read with a Registry measure. That path works on the free HWiNFO build, and it means Rainmeter itself does not need to run elevated. HWiNFO still does, as every tool that touches hardware directly does.
Does Windows 11 have a built-in system monitor widget?
Not on the Widgets Board any more. The CPU, GPU, RAM and network widgets that could be pinned there came from Dev Home, which Microsoft announced it was deprecating in January 2025 and stopped supporting in May 2025. What is left built in is Task Manager's Performance tab and the Xbox Game Bar performance overlay — both useful, neither a desktop widget.
Does Themia show CPU or GPU temperature?
CPU temperature and fan speed are both available rows on the CPU widget, but they need a sensor source: Themia ships no kernel driver of its own, so it reads from LibreHardwareMonitor or OpenHardwareMonitor if one is running and falls back to the ACPI thermal zone otherwise. Many consumer AMD boards report nothing over ACPI, so an on-die reading in practice means installing LibreHardwareMonitor. Fan speed has no driver-free source at all. Utilization, clock speed, per-core graphs, VRAM, RAM, disk throughput and network throughput all work with nothing extra installed.