CPU monitor
Processor load, clock speed, per-core graphs, temperature and the busiest processes.
What it does
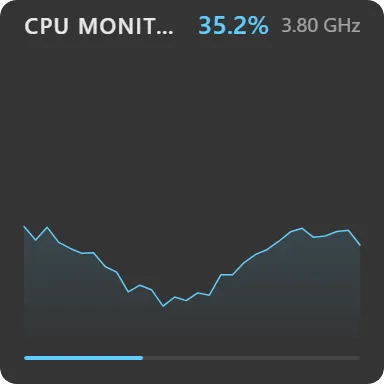
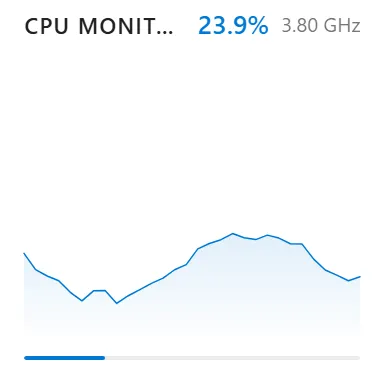
Shows what your processor is doing. The header carries current usage to one decimal and clock speed in GHz; below it a sparkline keeps the last 40 samples, and a bar tracks the current figure.
Usage changes colour as it climbs (accent below 70%, amber from 70 to 89, red at 90 and above), applied consistently to the number, the graph and the bar, so a machine under load reads across the room.
You choose which rows appear. Available metrics are usage, frequency, the aggregate graph, per-core graphs, temperature, fan speed, top processes, process and thread counts, and system uptime. Switching on per-core replaces the single graph with a grid of small ones, one per core.
Top processes lists the busiest processes by name, the friendly name Task Manager shows (“Google Chrome”, not “chrome.exe”), and you can show between one and ten rows.
Where the data comes from
Sampled locally on your machine, every 1 to 30 seconds depending on the refresh setting (default 2 seconds). Nothing is transmitted anywhere.
Two details are worth knowing:
Process figures are read through the same low-level Windows call Task Manager uses, rather than by opening a handle to each process. Handle-based reads fail for protected and elevated processes when Themia runs unelevated (Windows Update, Defender, Hyper-V), so those used to report 0% and never appeared in the list. They do now.
Temperature and fan speed need a sensor source. Themia does not bundle a kernel driver, so it reads from LibreHardwareMonitor or OpenHardwareMonitor if you have one running, and otherwise falls back to the ACPI thermal zone. On many consumer AMD boards the ACPI zone reports nothing, so the on-die reading is only available with LibreHardwareMonitor installed.
Limits
- Temperature and fan rows show Temp N/A / Fan N/A rather than vanishing when no sensor source is available. That’s deliberate: a metric you switched on disappearing reads as a bug.
- Fan speed has no driver-free source at all. Without LibreHardwareMonitor or OpenHardwareMonitor it is always unavailable.
- Several system widgets share one 500 ms cached sample, so adding more of them does not multiply the sampling cost.