Disk monitor
Free space and read/write throughput, for one drive or all of them.
What it does
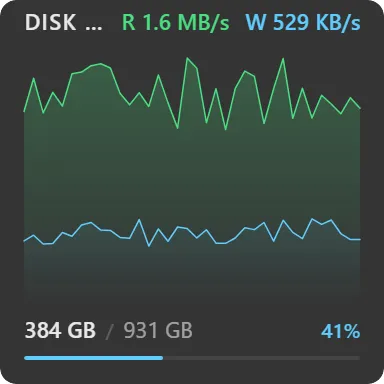
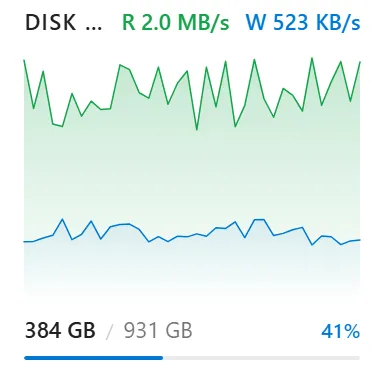
Shows used and total space with a percentage bar, plus read and write throughput in the header, measured per drive, not system-wide.
Select one drive and you get the full single-drive view: space, a bar, and two overlaid sparklines (read in green, write in accent) scaled against a shared maximum so the two rates are directly comparable. Select several and the widget switches to a stacked layout with each drive’s space bar in turn, scrolling if they outgrow the widget.
Clicking a drive opens it in Explorer.
Space colour shifts at 80% and 90% full.
Where the data comes from
The local system, polled every 1 to 30 seconds and shared with the other system widgets through one cached sample.
Limits
- Throughput graphs and the IOPS row are single-drive only. In multi-drive mode you get space bars.
- Network drives and drives reporting zero total space are not listed.
- SMART health, temperature and drive model are not surfaced.