Ping
Latency, jitter and packet loss against a host you choose.
What it does
Pings a host you name and reports whether it is up and how fast it answers.
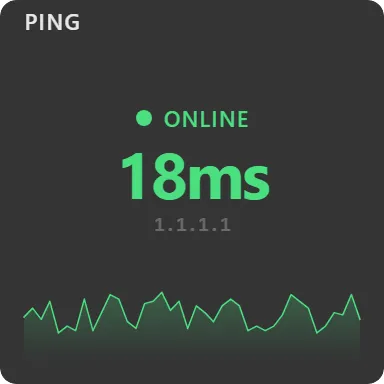
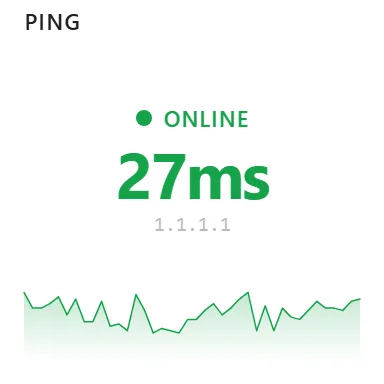
The status row reads Online, Offline or Checking…, with the colour carried through to the latency figure and the sparkline so the widget’s state is legible peripherally. Latency shows in milliseconds, switching to seconds past 1000 ms.
Additional rows you can switch on:
- Jitter: the mean difference between consecutive successful pings.
- Loss: the share of failed pings across the stored history.
- Min / avg / max: over successful samples.
A failed ping plots on the baseline rather than breaking the line, so an outage shows as a trough in the curve instead of a gap in the graph.
Give the host both a label and an address and the header shows the label with the address beneath; give it only an address and the header shows that, without repeating it.
Where the data comes from
Your machine pings the host directly. The only network traffic is the ping itself, to the address you configured.
Limits
- Known defect: a host that has never answered reads “Loss 0%” instead of 100%, because the loss calculation short-circuits on a history with no successful sample. A host that answers and then stops reports loss correctly.
- One host per widget.
- History holds 40 samples and does not persist across restarts.