Stocks
Price, change and a sparkline for one stock or cryptocurrency.
What it does
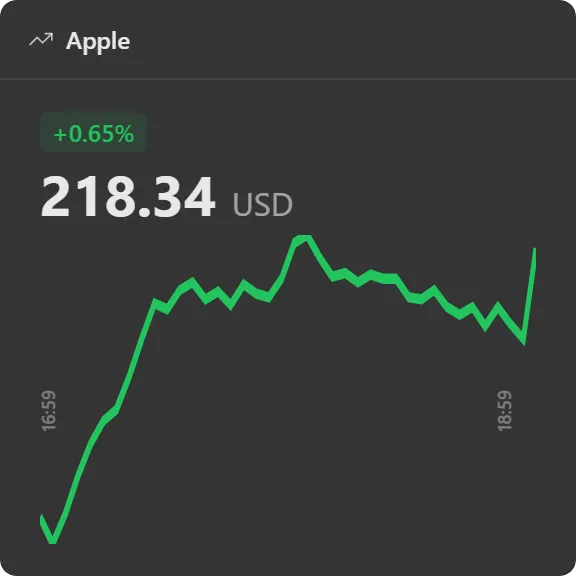
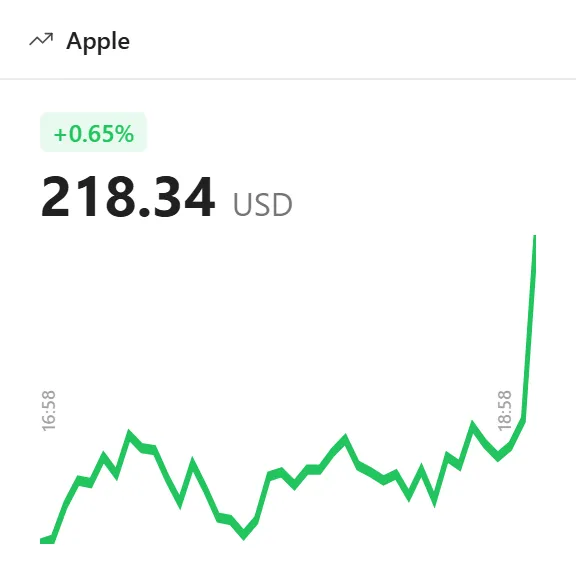
Tracks one symbol (a stock or a cryptocurrency), showing the percentage change coloured green or red, the current price with its currency, and a full-width sparkline labelled with the range’s start and end dates.
Price formatting adapts to magnitude: thousands separators and two decimals above 1000, two decimals above 1, and four decimals below 1, so a sub-cent token is still readable.
Options include the sparkline range, an area fill, min/max markers, custom up and down colours, and whether to show extended-hours trading.
Market closed shows as a badge with a moon icon when a stock’s exchange is shut. The session is worked out from the exchange’s own trading schedule and evaluated against the clock every minute, so the badge is correct immediately on a cold start and flips at the opening bell rather than at the next refresh. Crypto is never marked closed, because it never is.
Where the data comes from
Yahoo Finance’s public chart API, requested by your machine for the symbol you configured.
Limits
- One symbol per widget. There is no multi-symbol list view; use several widgets for a watchlist.
- Prices are delayed as per the upstream source; this is not a trading tool.
- If the exchange schedule is missing or malformed the session reads as unknown and no badge is shown, rather than wrongly claiming the market is closed.