Network monitor
Download and upload throughput with a live graph.
What it does
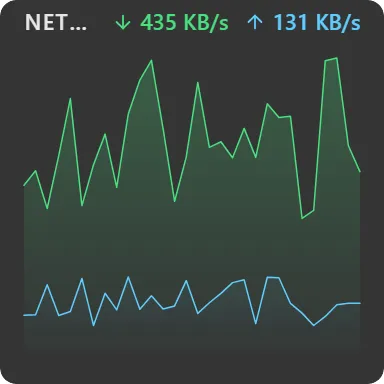
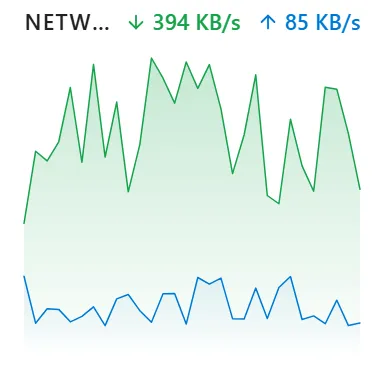
Shows current download and upload rates in the header, with adaptive units (B/s, KB/s, MB/s or GB/s depending on magnitude), and two overlaid sparklines below, download in green and upload in accent.
Both lines share one vertical scale, so you can see at a glance which direction is actually carrying the traffic rather than reading two independently-scaled graphs that look the same.
History keeps the last 40 samples; refresh runs from 1 to 30 seconds.
Where the data comes from
Aggregated locally across your network interfaces. Capture mirror interfaces are excluded, so tools like Wireshark don’t double-count your traffic.
Limits
- Totals across all interfaces. There is no per-interface or per-application breakdown.
- Rates only: no cumulative data-usage counter, and nothing persists across restarts.
- For reachability and latency rather than throughput, see the Ping widget.