Memory monitor
RAM in use against total, with a rolling graph.
What it does
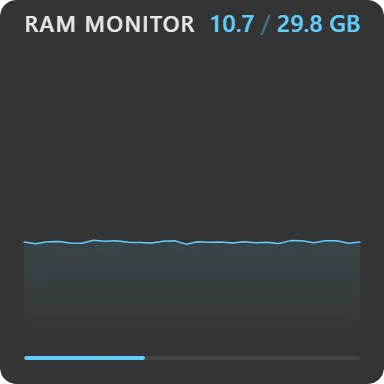
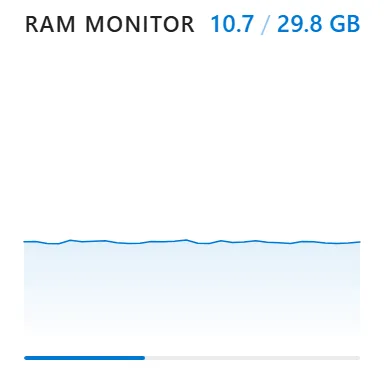
Shows how much memory is in use against how much you have, in GB to one decimal, with a bar and an optional sparkline holding the last 40 samples.
The figure changes colour as pressure rises (accent below 70%, amber from 70 to 89, red at 90 and above), across the number, the graph and the bar together, so a machine that is swapping reads at a glance.
Refresh runs every 1, 2, 5, 10 or 30 seconds; the default is 2.
Where the data comes from
Sampled locally. Several system widgets share one 500 ms cached sample, so running Memory next to CPU and Disk costs one measurement, not three.
Limits
- Total and used only. There is no per-process memory breakdown here; the CPU monitor carries a top-processes list that includes memory.
- No swap or commit-charge figures.